Who can use this
- Users with Reporting access can open the Reporting page.
- Users with access to all dashboards can view the organization’s dashboards.
- Users with limited access see only dashboards granted to them.
- Users with create access can add dashboards, build reports, configure custom fields, and manage rubrics.
- Admins can also manage Reporting email cadences and rep performance views.
What appears in Reporting
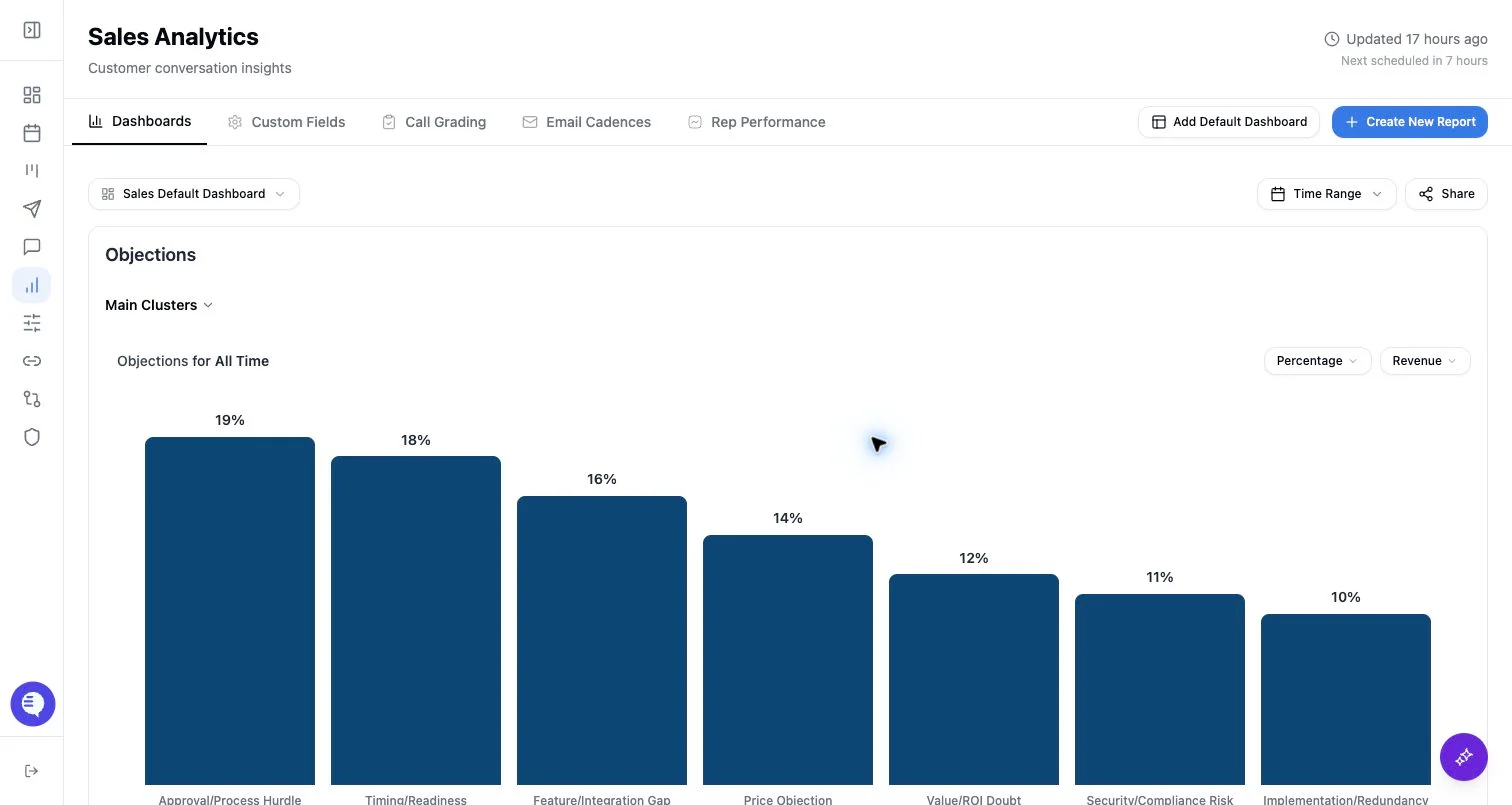
- Dashboards: saved collections of chart widgets.
- Custom fields: sentence, picklist, and numerical fields used as report categories or filters.
- Call grading rubrics: scorecards that can be used in reporting charts.
- Email cadences: recurring reporting emails with selected or automatically chosen fields.
- Rep performance: admin-only email response metrics when computed for the organization.
Read a dashboard safely
- Open Reporting.
- Choose the dashboard you want to review.
- Check whether a dashboard-level time range is active.
- Open individual charts to confirm field, breakdown, filter, chart type, and time range.
- Use drilldowns or source evidence when available before making coaching or pipeline decisions.
What to expect
- Reporting status may show whether reporting data is eligible and whether clustering is still running.
- Dashboards can load before all fields or charts are fully refreshed.
- Filters and dashboard grants affect what the viewer sees.
- Shared reporting links can expose a narrower experience than the authenticated Reporting page.